de en

E-Mail: Übersicht, Öffnungs-/Klickrate

'Overview' tab

The overview summarizes the most important key figures and recipient reactions of your mailing.

At the top right you will find two quick links:

  • Refresh Statistics: Reloads the statistics page to show the latest data.
  • Export CSV file: Exports the statistics data as a CSV file for external analysis.

--> Open rate, click rate, bounce rate
The three most important key figures are displayed in the colors red|yellow|greendepending on the success:

KPI

  • The open rate (unique) indicates what percentage of the delivered mails were opened at least once. The more trustworthy the sender and the more interesting the preheader and subject line, the higher the open rate. Its average value is around 25%, depending on the industry.

    The mobile share indicates the percentage of opens that took place on a mobile device. Multiple openers who opened a mail on different devices are also taken into account here. The percentage of mobile openers gives an indication of how important mobile optimization of the content and the email template is in the case of your target group.

  • The effective click rate (unique) is the click rate of the openers. It indicates what percentage of openers (at least) clicked on a link in the mailing. Do the subject line and content match? Did the content meet the expectations of the openers? Since only the reactions of the openers are considered, the opening rate and delivery rate (number of bounces) play no role in the calculation. Therefore, this variable is well suited for analyzing which content variant was more successful. It is also called click-trough-rate (CTR). Its average value is about 15%, depending on the industry.

    The click rate displayed below refers to all deliveries including non-openers. It indicates what percentage of recipients (at least) clicked on a link in the mailing. In other words, it depends on the opening rate. It can only reach high values if the open rate and effective click rate are high. Therefore, it is a good test criterion for an A/B test with automatic winner dispatch. It is also called click-through rate (CTR). Its average value is about 3.5%, depending on the industry.

  • The bounce rate indicates the proportion of undeliverable mails. Depending on the industry, its average value is around 3%. The breakdown into hard bounces (permanent problem, e.g., email address no longer exists) and soft bounces (temporary problem, e.g., full mailbox) can be analyzed in detail in Bounce Management.


 How to adjust the red|yellow|green color switching to the values of your own mailings is described under 'Own settings' -> 'System settings' -> 'Statistics settings'. This way, you can see at first glance whether your current mailing is  outperforming or underperforming underoerforming compared to your previous mailings based on the color.

FAQ: When can I expect the first statistics data? Please give the statistics some time after sending your mailing. Experience shows that you will see a first trend about one hour after sending. The reason for this is that the opening and click reactions of your subscribers as well as the bounce responses of the recipient side must first be awaited and evaluated. The statistical data is only actually representative a few days after the mailing.

Note: The statistics display always refers to the "historical" subscriber base at the time of dispatch. This means that it is independent of currently unsubscribed or deleted subscribers. Internally, Ideenfabrik Mailingwork uses a copy of the subscriber data at that time, which was "frozen" especially for the statistics evaluation.

--> Deliveries

This area shows the dispatch success of your mailing.

In the middle of the pie chart you can see the delivery rate of your mailing. This refers to the proportion of mailings actually sent compared to the planned number of recipients:

  • Planned recipients: these are the recipients you had selected for mailing by choosing the subscriber list(s) and target audience(s).
  • Deliveries: To these subscribers the mailing was actually sent.


In practice, the delivery rate is usually below 100%. There are two reasons for this:

Reason 1) Some mails were not sent because they were already sorted out before being sent:

  • Logically wrong: Mailings are not deliverable to logically wrong email addresses (mostly typos), see 'Logisch falsche Adressen'.
  • Blacklist: Mailings are not sent to these recipients, see 'Blacklist'.
  • Complaint list: No mailings will be sent to these recipients either. The complaint list contains subscribers for whom a complaint was registered in previous mailings. "Complaint" means the recipient had marked the mailing as SPAM in the inbox instead of using the regular unsubscribe link, for example. However, only a few webmailers pass these complaints on to us. This means that the displayed number is suitable for identifying a trend when compared with other mailings, but may be higher than displayed.
  • Withheld: After an email address generates a hard bounce 3x in a row, it will not be written to in the future, according to the Certified Senders Alliance specifications. With this measure ###system_name## avoids unnecessary sending volume and prevents future bounces.
  • Creation error: For these recipients, the creation of the mailing failed. Reasons for this are a missing sender address or a file attachment that could not be found. Please check whether you have personalized the sender address of the mailing, i.e. whether the placeholder of a personalization helper or subscription field is entered instead of a fixed sender address. If the personalization of a subscriber does not find any data, the sender field remains empty and the mail cannot be created. Next, please check if you have activated a file attachment with the option 'Attachment from external source' and if the entered URL is correct.

 Reason 2) Some mails were sent but are undeliverable:

  • Bounces: indicates the number of currently undeliverable emails. It is composed of hardbounces, softbounces and other bounces, see 'Bounceübersicht'.


Tip: Click on 'Deliveries' in the legend on the left to hide the large 'Deliveries' segment in the diagram next to it and zoom in on the "small" segments to 360°. Their percentages also adjust to the new arrangement, so that the ratio of the remaining segments can be easily compared.

--> Regional distribution

The map shows the regional distribution of mailing openings, which were automatically determined by geotargeting.


The more openings per country were counted, the more intense its coloring. By clicking on the country, an enlarged view appears with the cities where the openings took place. The larger the dot, the more openings were counted for that city.

By clicking on 'full screen' the map is displayed in the entire window. Directly below the full screen link you can download the graphic of the map in different formats via the download button.

Note: Although IP addresses are generally not bound to a specific location, the known IP address spaces of Internet providers, universities and similar institutions can be used to determine the location in many cases. Since regional dial-up nodes often have a fixed IP address pool, the procedure also works with dynamic IP assignment. For mapping, ###system_name## uses a regularly updated local copy of a geotargeting database provided by an external service provider.

--> Top 5 links + openings by date and devices

As with any other chart, the data displayed can be downloaded as a graphic or Excel file via the download button (top right corner).

Individual chart segments can be shown or hidden by clicking on the corresponding point in the legend, e.g. on 'Desktop clients' in the 'Openings by devices' chart. This zooms the remaining segments to 360° and their percentages adjust to the new arrangement. In this way, the ratio of any segments can be compared directly.


In the three charts you can see:

  • Top 5 Links: The five most clicked links are shown sorted by their number of clicks. Counting 'unique' means that each link click is counted only once per recipient. Counting 'total' means that multiple clicks of the same link per recipient are also counted. This includes renewed clicks at a later time or on another device, e.g. due to a forwarding to colleagues.
  • Openings by date: Here, the openings are displayed over a 10-day period from the date of dispatch. The entries 'unique' and 'total' refer to single and multiple openings per recipient, respectively, similar to what is described for clicks.

The opening history shown above is typical of a well-chosen dispatch time that immediately picks up the target group. Around 80% of openings take place in the first 24h after dispatch.

  • Opens by devices: This distribution shows with which device classes the mail was opened. Multiple openers are taken into account, e.g. those who opened the mail first on a mobile device and then on a desktop PC. The proportion of mobile openers gives an indication of how important mobile optimization of the content and the email template is.

--> Interests

If you have assigned interests to the links of your mailing, then the distribution of interests is displayed according to the click frequency of these links.


Here, too, the displayed distribution can be downloaded (top right button).

Individual interests can be hidden by clicking on their legend point in order to directly compare the ratio of the remaining interests.


--> Trends of the last mailings

Here, the trend of the most recently sent mailings is displayed for various parameters.

  • Open rate of delivered mails
  • Click rate of the delivered mails
  • Bounce rate of the intended recipients
  • Unsubscribe rate of the delivered mails
  • Recommendation rate ("Tell-a-friend") of the delivered mails
  • Profile change rate of the delivered mails

'Opening rate' tab

Here you will find three additional options to evaluate the openings of your mailing in detail:

  • With the help of the 'Filter settings', the calculation can be filtered to a target group and a time period. This allows you to quickly compare the opening behavior of different target groups in the selected period. If the processing of personal user data (subscriber profiling) is not activated in the account, only the period filter is available.
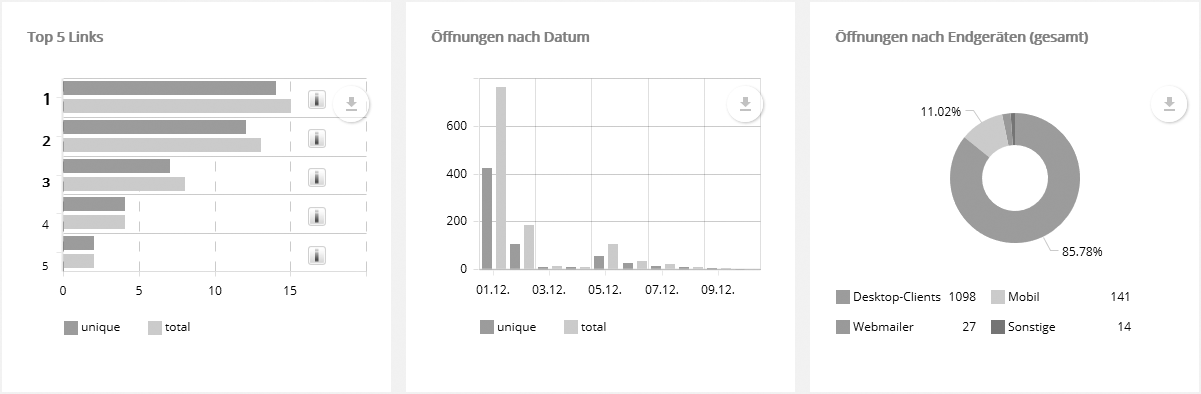
  • The opening history by days and time tells you when your recipients are active. In combination with A/B tests, this allows you to find the optimal sending time for your target group.
  • The frequency of the end devices and mail clients used gives you indications of what you should focus on when designing future mailings.

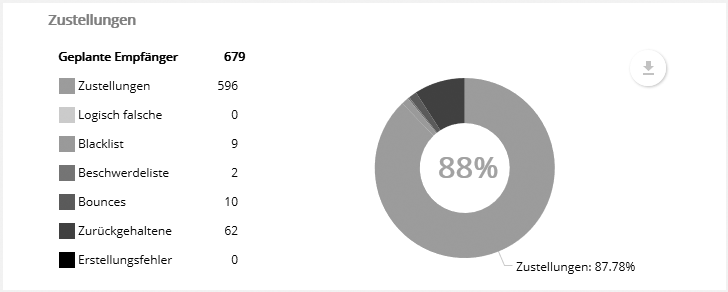
By the way: a mailing is considered opened when the recipient loads an image of the mailing or clicks on a tracked link. For this purpose, Ideenfabrik Mailingwork links an invisible tracking pixel in the mailing as soon as automatic tracking is activated in the 'Advanced settings'. The measurement via tracking pixel requires that the recipient allows the display of images in his inbox.


Filter settings for standard mails

A period of 10 days from the start of shipping is preset. All displayed values refer to the selected filter of target group and time period. Therefore, depending on the selected filter, they can be significantly lower than the unfiltered total values of the 'Overview' tab.

The following screenshot shows the filtered opening data of subscribers of the target group "Women" in the period of 7 days from the start of dispatch.


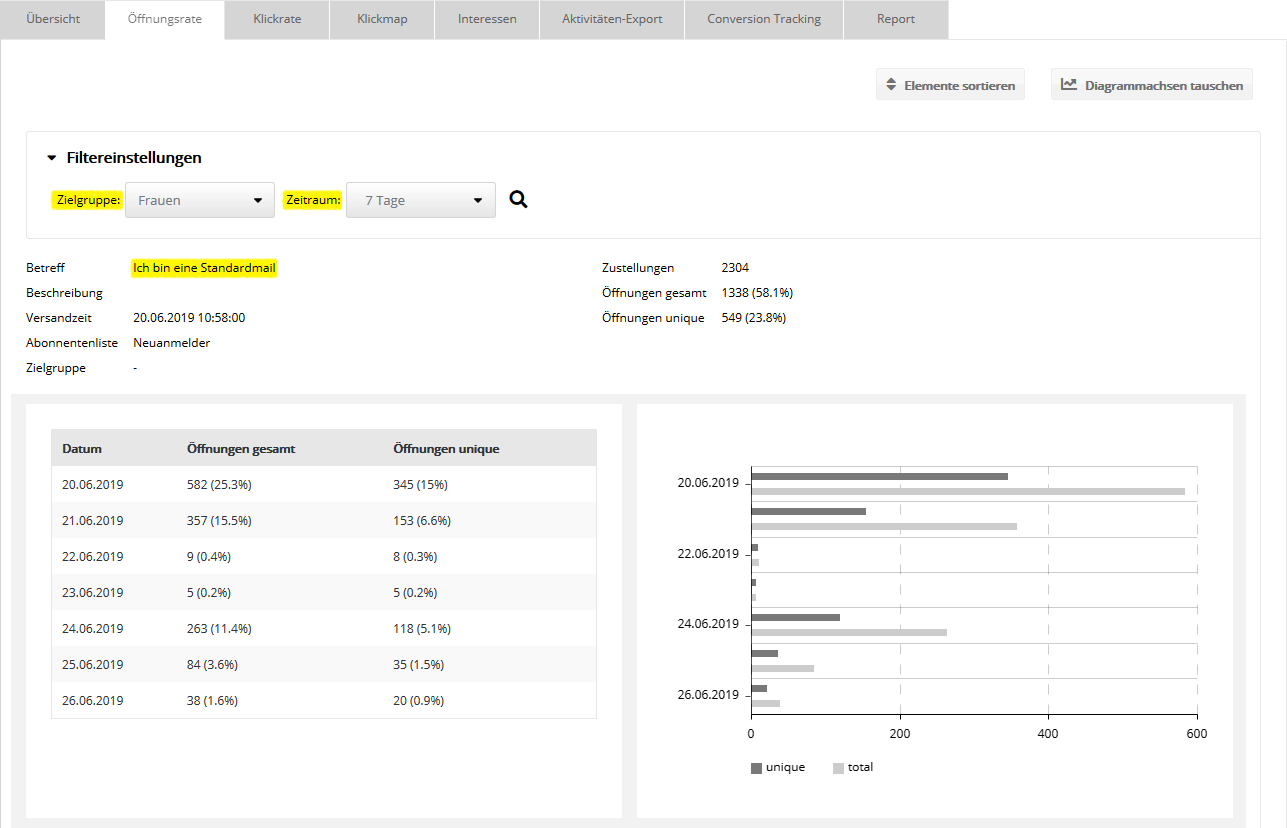
Note: To ensure that the statistics display is independent of subscribers who have unsubscribed or been deleted in the meantime, the data of the subscribers involved is copied internally at the start of dispatch and thus quasi "frozen". In this way, the "old" statistics can also be filtered on the basis of new target groups that were not created until after the dispatch. This option is only available in the statistics. Outside the statistics, target groups always filter the current subscriber data.

Filter settings for dialog- and campaign emails

  • Dialog- und Kampagnenmail: Der Versandzeitpunkt ist für jeden Abonnenten individuell. Der Versand findet ereignisgesteuert statt, z. B. sobald sich ein neuer Abonnent anmeldet oder ein vorhandener Abonnent eine Zielgruppe betritt. Die Versendungen können sich über Monate oder Jahre verteilen, wenn die Mail entsprechend lange aktiviert ist.

Deshalb werden für Dialog- und Kampagnenmails die Öffnungen separat ausgewiesen, deren Mails wurden. Als "Extrembeispiel" soll der folgende Screenshot dienen. Er zeigt eine alte Kampagenmail, die seit 2018 nicht mehr aktiviert ist.

The filter options correspond to those of standard mails, see above. However, the default setting "10 days" does not refer to the 10 (oldest) days from the start of sending, but to the 10 most recent days at the moment.

These are much more interesting for dialog and campaign mails, because there is a significant difference in sending compared to standard mails:

  • Standard mail: You specify the sending time fixed, the same for all subscribers. Even with activated dispatch time optimization, the dispatch is finished after 7 days at the latest for all subscribers. The majority of responses are concentrated in a few days.
  • Dialog and campaign mail: The dispatch time is individual for each subscriber. Dispatch is event-driven, e.g. as soon as a new subscriber signs up or an existing subscriber enters a target group. The mailings can be spread over months or years if the mail is activated for a correspondingly long time.

Therefore, for dialog and campaign mails, the openings are shown separately whose mails were delivered in the selected period delivered in the selected period. The following screenshot serves as an "extreme example". It shows an old campaign mail that has no longer been activated since 2018.

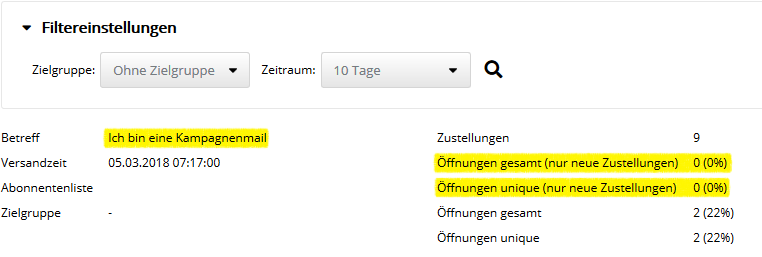
The 'Sending time' shows the date when the mail was activated for the first time.

On the right side, the 'Deliveries' number shows the total value of all deliveries, regardless of the filter period.

The openings shown always refer to the set filter period, just like for standard mails. For the two yellow marked lines there is an additional restriction:

  • Openings (new deliveries only): filters opening date and delivery date according to period. This specification does not appear for standard mails.
  • Openings: Ignores the delivery date, as for standard mails.

Since the sample mailing has already been deactivated since 2018, there were no new deliveries in the last 10 days. Nevertheless, there were still 2 openings in the last 10 days, quasi "late igniters", who opened the mailing only years after delivery. An admittedly somewhat constructed example, but which hopefully clarifies the function.


Daily course of openings

Here, the 'total openings' and 'unique openings' are displayed for each day in the selected period, i.e. each value relates to a single day. The 'unique' rating also always applies anew each day, i.e. 'local' for this one day.

Example: The day table shows a period of 7 days. If the same subscriber opens the mail daily, this results in a unique daily opening for each of the 7 days. In relation to the entire period, he still has only one unique opening. Therefore, the sum of unique openings in the day table will often be greater than the unique number at the top of the summary or on the 'Overview' tab.

'Click rate' tab

This tab complements the 'Overview' tab in two essential ways:

  • For each individual link, the 'Total clicks' and 'Unique clicks' are displayed. In addition, the click history is displayed by day (column 'Actions' --> 'Daily history'). Behind this, the additional action "Link comments" is offered for links that appear several times in the newsletter with the same URL. Here the click performance is broken down according to the different link comments.
  • The calculation of the statistics can be restricted to a target group and a time period using the 'Filter settings'. This allows you to examine the click behavior of your recipients in an even more targeted manner.

Each click of the recipient on a tracked link is counted.

At the top right, the 'Sort elements' link can be used to change the order of the charts shown.

Regarding 'Filter settings', the same applies as described in the previous section on the 'Open rate' tab.

In the link listing, the 'unique' actually refers to that one link. This means that if the user has clicked on 10 different links in the mailing, this will result in a unique link click for all 10 links in the link list. In relation to the entire mailing, however, only one unique click is included in the statistics. Therefore, the sum of unique clicks in the link list will often be greater than the unique number at the top of the summary or on the 'Overview' tab.

In the left column, the link ID is displayed for each link. This is used to uniquely assign the links in the activity export and as a parameter for the web service functions to query the link statistics.

Note: The statistics display always refers to the subscriber base at the moment of dispatch. This means that it is independent of subscribers who have been unsubscribed or deleted in the meantime. Internally, Ideenfabrik Mailingwork uses a copy of the subscriber data at that time, which was "frozen" especially for the statistics evaluation. Thus, under 'Filter settings', it is even possible to select a newly created target group in order to filter the statistics of an "old" mailing according to new criteria. This option is only available in the statistics. Outside the statistics, target groups always filter the current subscriber data.

Tags: